Christmas tree

This year we decided to add some RGB programmable lights to our Christmas tree.
However, having worked with OpenCV on our PiWars Robot we thought we could make the lights even cooler.
The problem: RGB programmable light strips are numbered serially. You have light 0 at the base, then light 1, light 2, light 3 and it winds around the tree up to the top to light 99. When you create an animation of every light turning on one by one, the animation goes around the tree. Being a cone though, you lose sight of the animation when the lights go round the back of the tree and it looks a bit rubbish.
What you want is to program the lights to turn on: sweeping from the bottom to the top in 3d. So no matter where you're looking at the tree from, there's an aimation.
How we did it
Setup the lights
- Find the IN side of your lights. Some strips say DIN, some just have an arrow pointing away from you. Most of the lights I've bought: the IN end has a female connector
- Connect Ground and Power of your light strip to Ground and Power of a power source. I use a barrel jack connector so I don't have to chop up my power source.
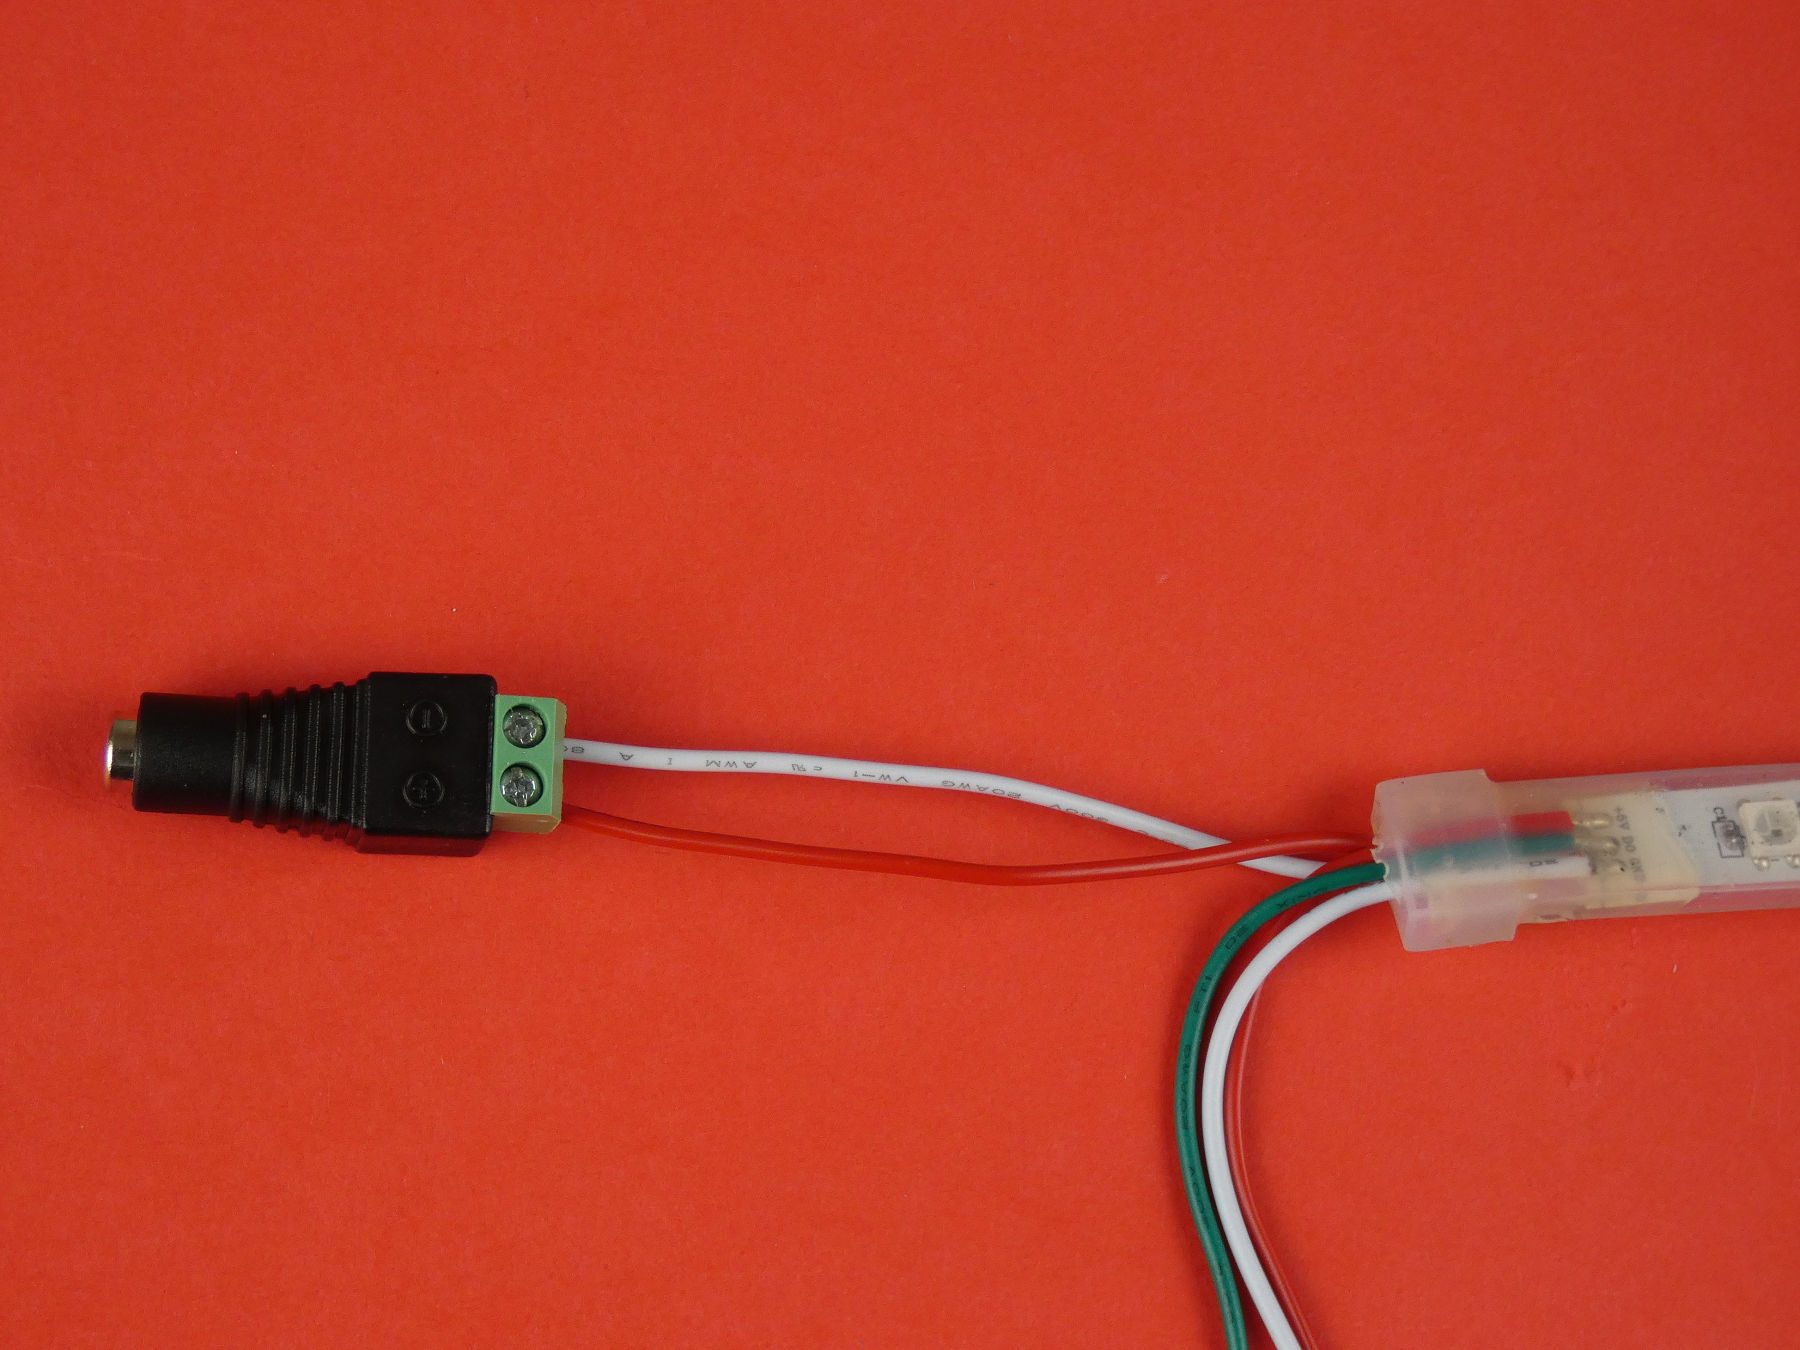
My power source is a 5V 4A power source.
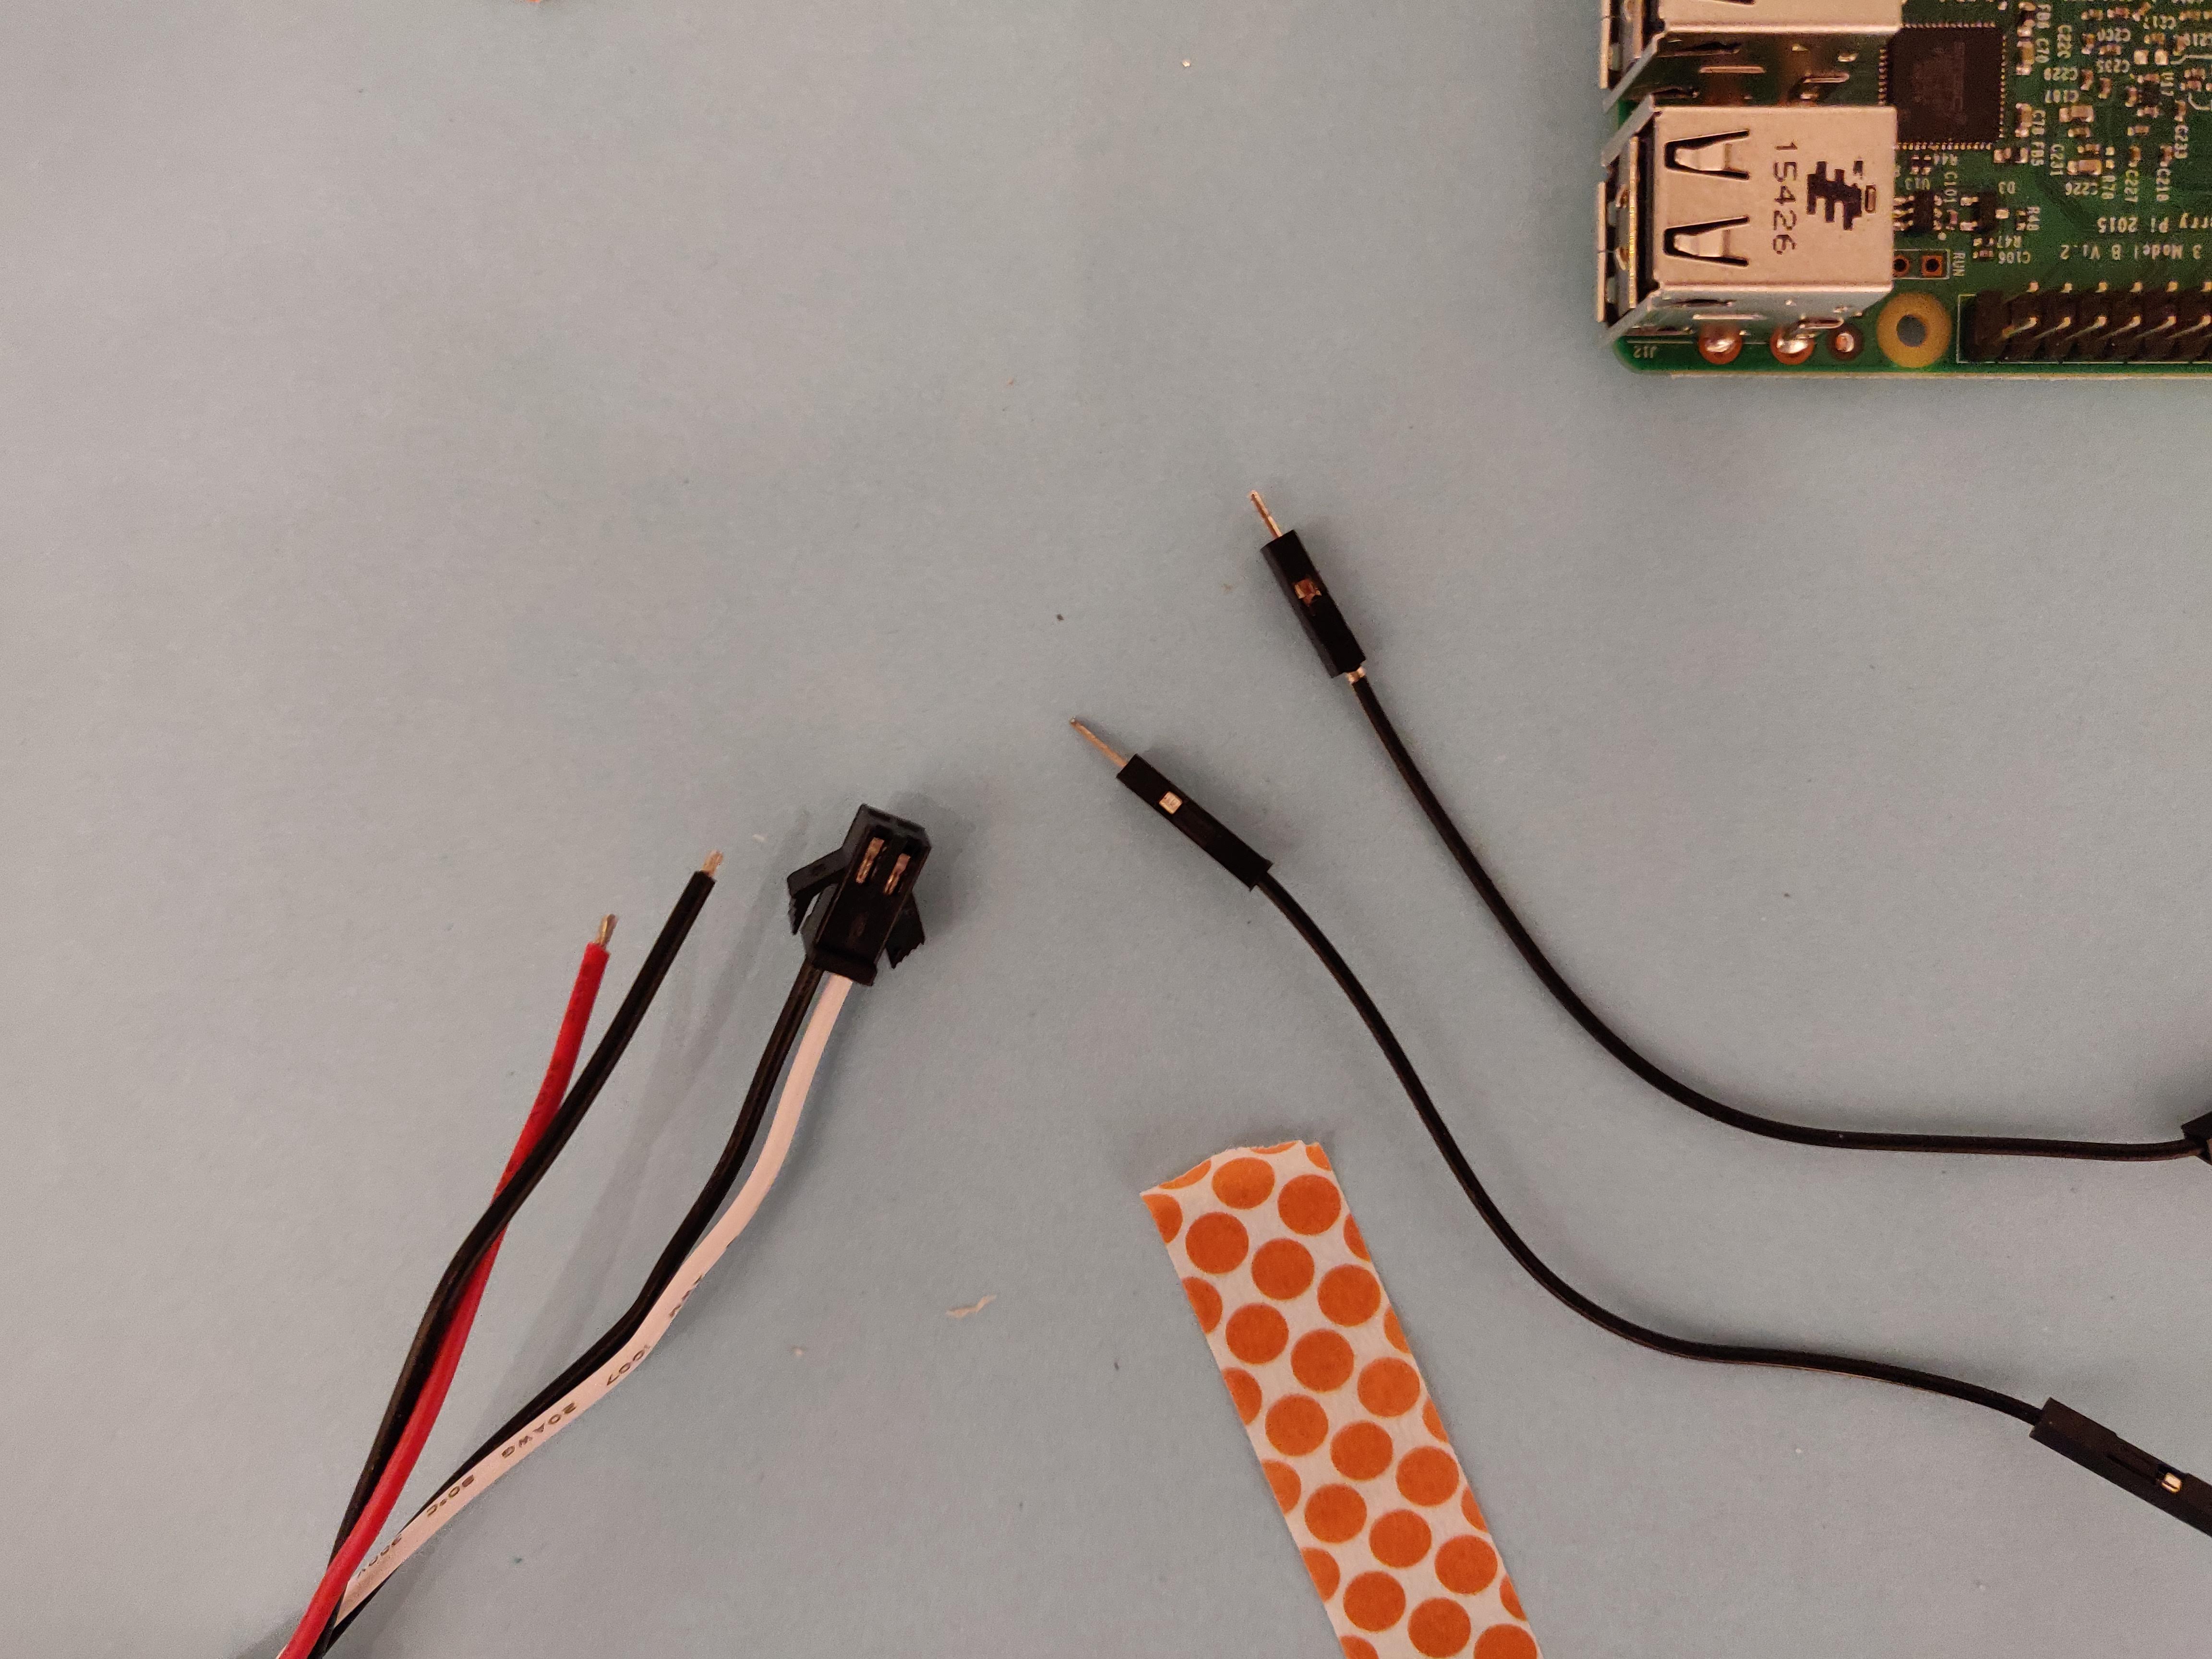
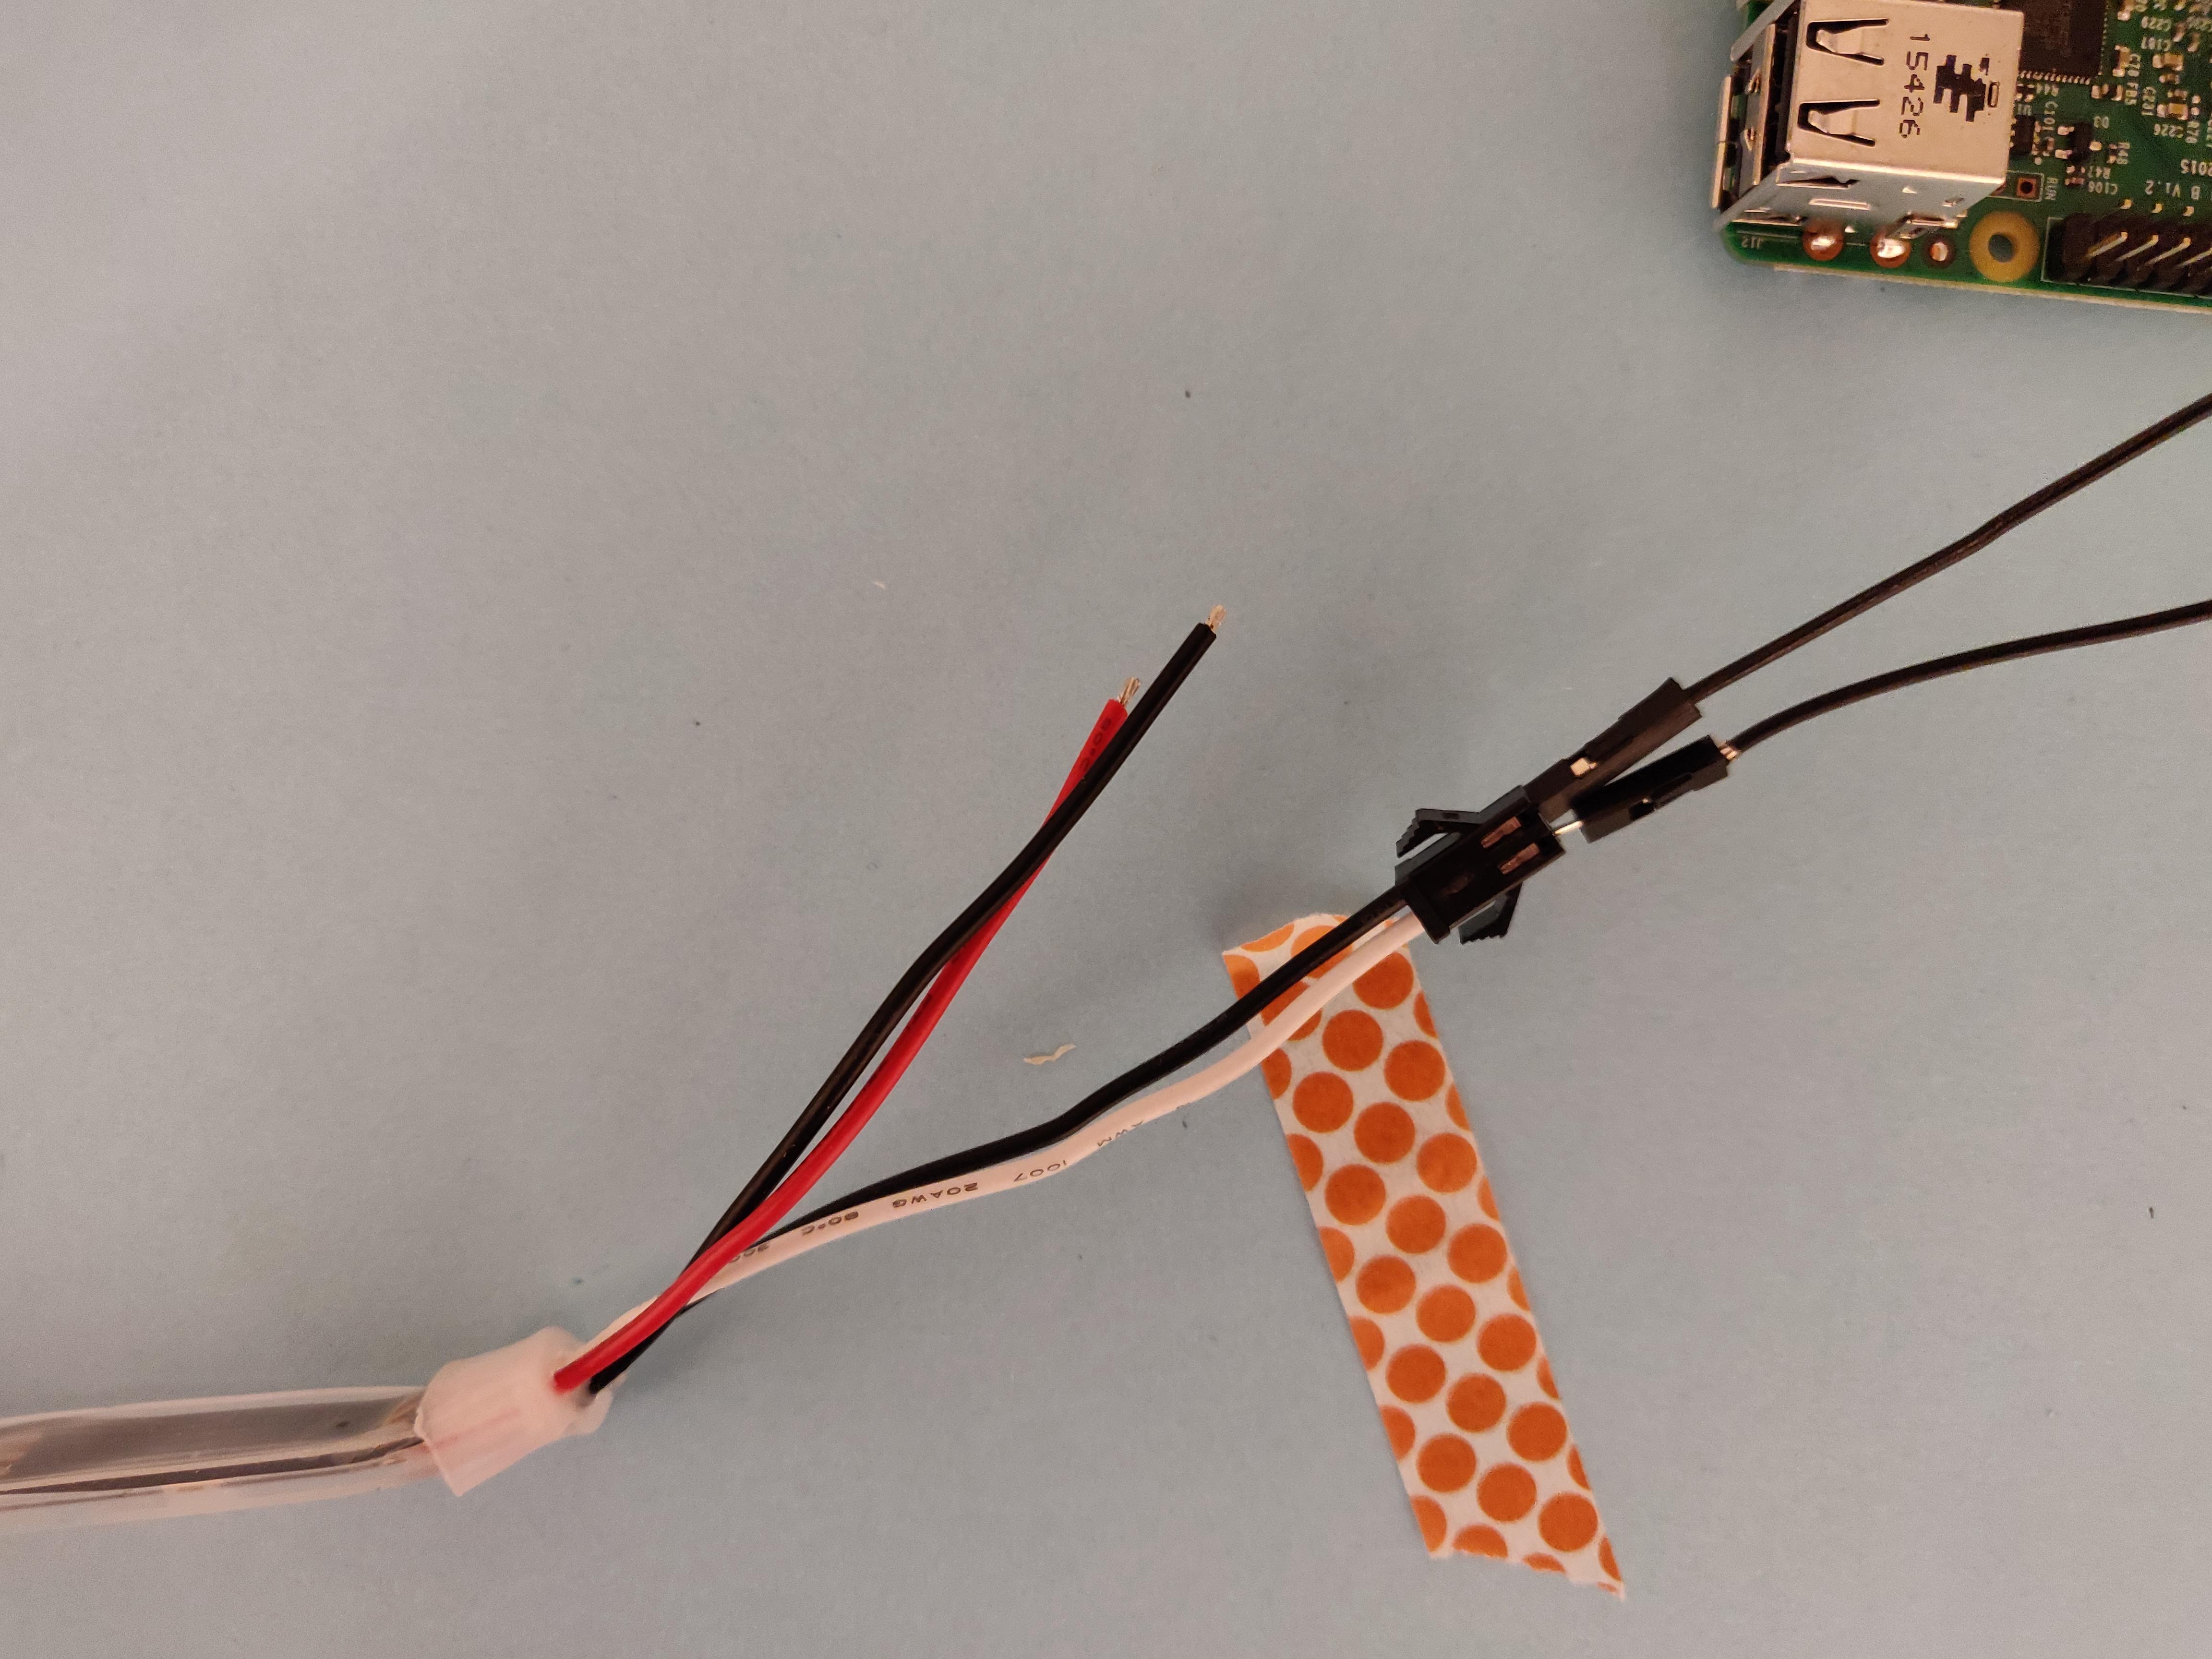
- Connect Ground and Data to the Raspberry Pi. I use the connector that's already attached to plug male-to-female jumper wires into the Ground and Data slots.
Male end goes into the light strip connector, female end onto the pins on the Raspberry Pi
- Install the Neopixel library
- Write some code to turn on each light one by one
Setup the camera
- Away from the tree, setup a Raspberry Pi with a camera attached. Take some photos to make sure you've got the whole tree in shot using raspi-still
Take and process photos
We have two Raspberry Pi's here. Let's call one Tree and the other Camera.
Tree sets itself up as a server so Camera can control it.
- Take a photo with all lights off on Raspberry Pi Camera. This is our base photo.
- Set light 0 to red
- Take a photo
- Get the XY pixel coordinates of light 0 using that photo and the base photo (OpenCV)
- Print those coordinates
- Repeat steps 2 to 5 for all 100 lights.
- Rotate the tree by 90 degrees
- Repeat steps 1 to 6
We rotated the tree 3 times so we had a full 360 degree view of the lights. We don't actually save the photos but if we did, we'd have 404 photos. 4 base photos of the dark tree and the 100 lights in the 4 different angles.
Processing the data
From OpenCV we get the XY coordinates of each light for 4 different angles. Working out the 3d coordinates for each light was a bit of a hack job. On the tree we have 3 axis: Height, North and East. The zero of each axis would meet in the middle of the tree. Our final coordinates for some lights will have minus coordinates.
This stuff is really hard to explain! There are videos at the end
With all the data I worked out the East scale for each angle. I then worked out where each light was on that scale.
The East scale is if you stood in front of the tree with your arms open for a hug. The coordinates for a light on the East scale would be true if you were standing behind or in front of the tree.
Some sample data:
The scale for angle 1 is 199 to 381
Light 30 in angle 1 was X:381 and Y:289
Using the X scale midpoint as 290. The East coordinates for light 30 is 381-290=91.
We rotate the tree 90 degrees to work on the North coordinates.
The X scale for angle 2 is 225 to 411
Light 30 in angle 2 was X:396 and Y:287
Using the X scale midpoint as 318. The relative X coordinate light 30 in angle 2 is 396-318 = 78
Light 30 is 91 East, 78 North on the tree.
I repeated the photographs and calculations for angle 3 and used the average number between angle 1 and angle 3. Same for angle 2 and 4.
To work out the Height coordinates, we found the tallest light and the shortest light in all angles. Calculated the average between the two.
We took all the Y values for Light 30, worked out the average and then got it's height coordinate for the whole tree.
Here's a few videos of me explaining me with the tree. Once we had the graph we created some graphics to play on it
The final graph
Here's the code I used to create this